
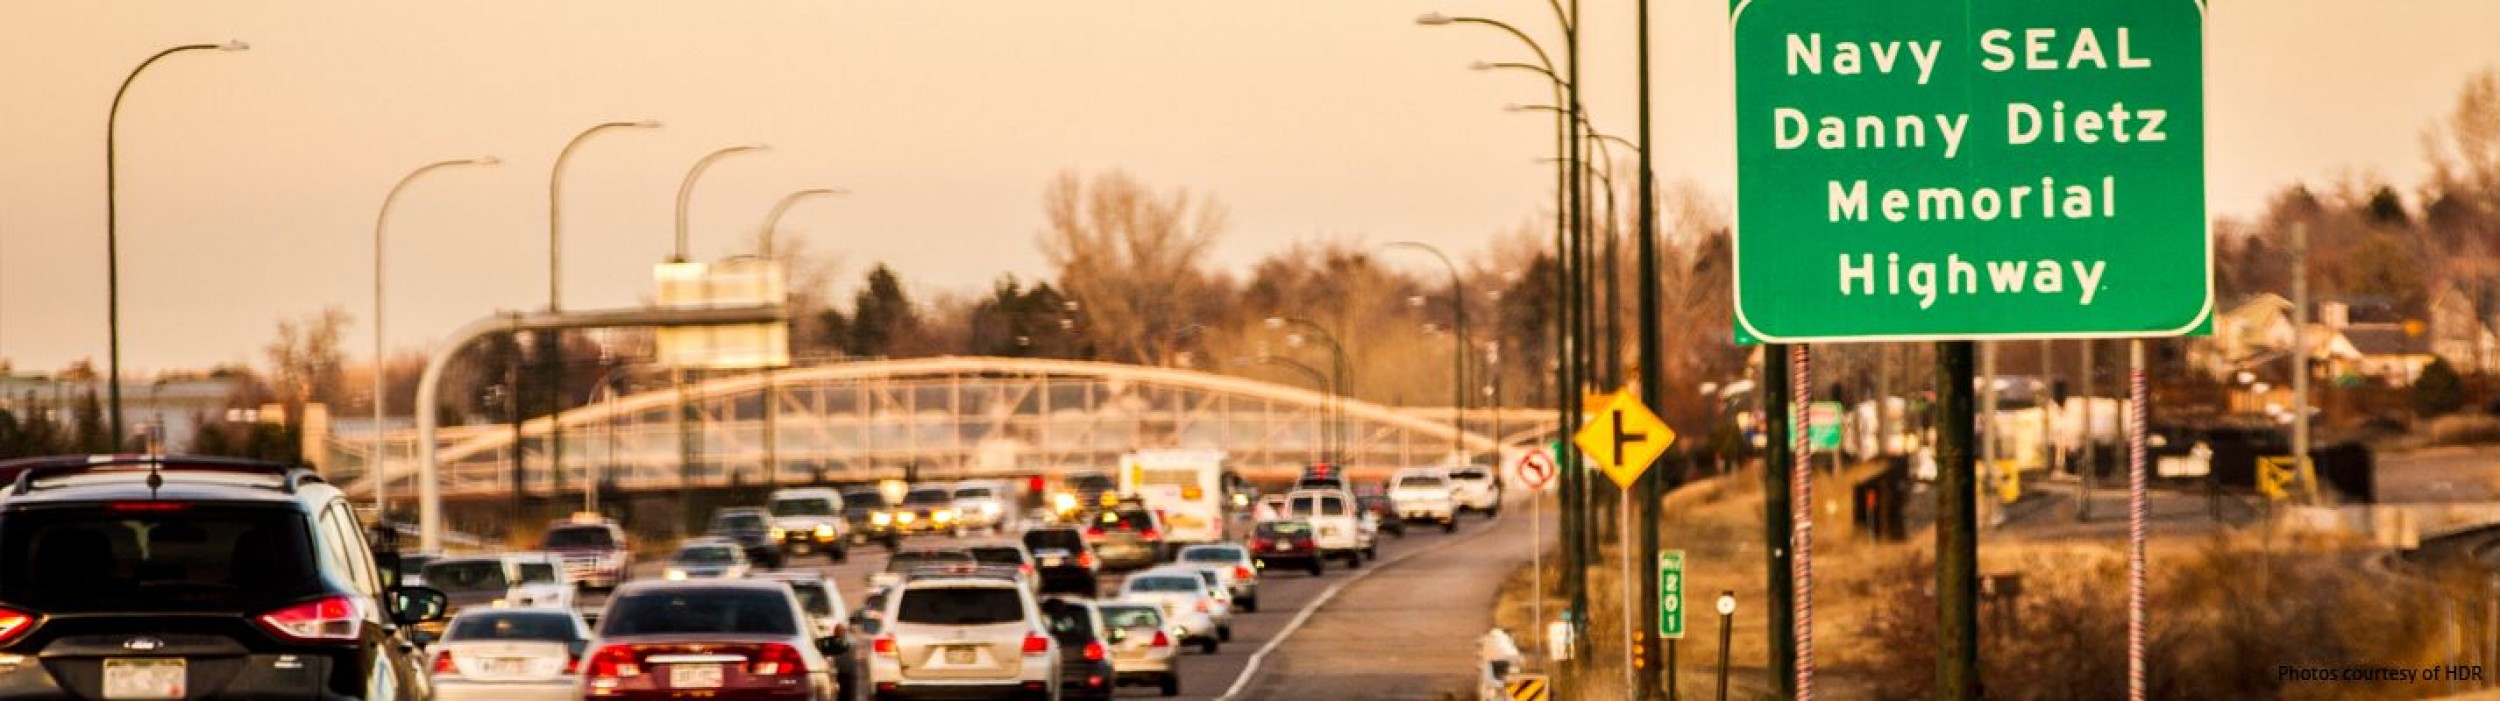

Highlands Ranch Parkway to C-470 Project
The Highlands Ranch Parkway to Colorado Highway 470 (C-470) Re-evaluation was completed in July 2017 as an update to the 2002 Record of Decision (ROD) to address changes to conditions that have occurred since it was issued by the Federal Highway Administration (FHWA). The Reevaluation identifies changed existing and future conditions; identifies a refined Selected Alternative for improvements to improve capacity, operational performance and safety for traffic volumes in 2040; identifies changes in legislation, regulations, and guidance related to the improvements; reanalyzes impacts; and develops needed changes to the mitigation measures identified in the FEIS/ROD. You can review the final Re-evaluation document here.
Re-evaluation Appendices
Appendix A Technical Reports
Modified Environmental Site Assessment
Appendix B Agency Coordination
Appendix C Public Involvement
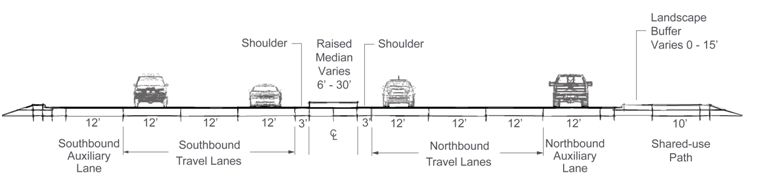
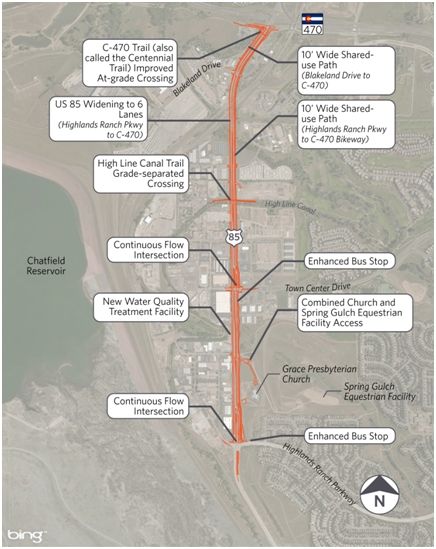
Construction is expected to include the following improvements cumulatively described as the Refined Selected Alternative between Highlands Ranch Parkway and C-470:
- a six-through-lane section (eight lanes including the auxiliary lanes)
- continuous flow intersections at Town Center Drive and Highlands Ranch Parkway
- a raised median, inside curb and gutter, outside curb and gutter, inside shoulders, and continuous auxiliary lanes
- bus stop enhancements
- a shared-use path for bicycles and pedestrians on the east side of the road
- improvements to the High Line Canal Trail by changing the existing at-grade crossing to a grade-separated crossing under US 85
- access consolidation includes modification to right-in/right-out accesses
The following two images provide cross section and plan view diagrams of the improvements.
The following chart shows traffic growth forecasts for typical regional traffic growth (blue) and accelerated growth of Chatfield Basin (green). The dashed lines depict how much capacity different types of improvements provide for the levels of traffic. Download the PDF version.
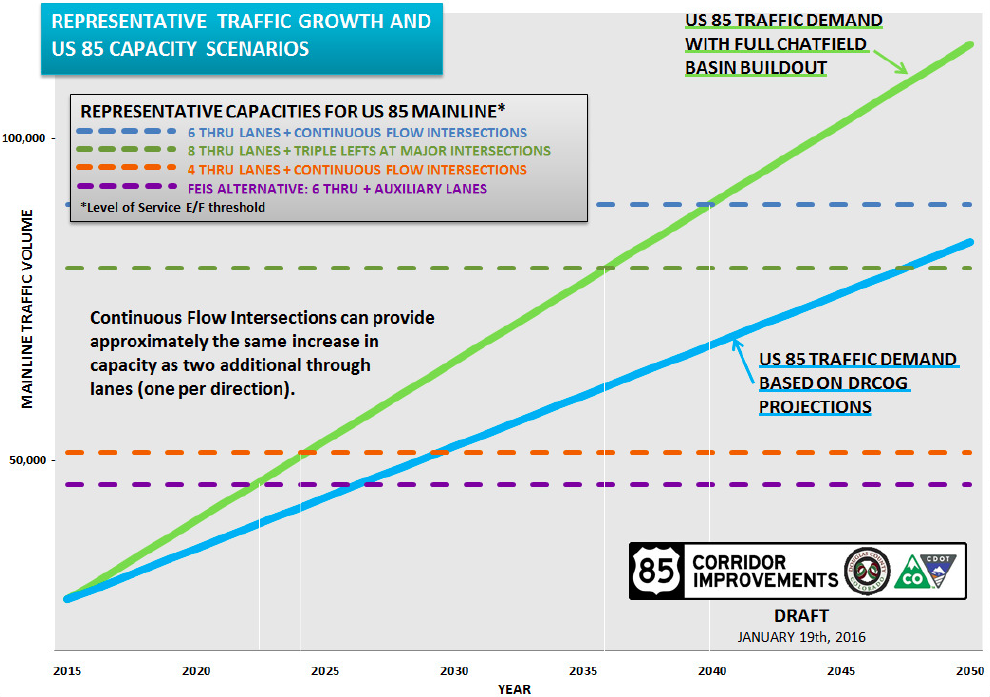 US85 Capacity Scenarios